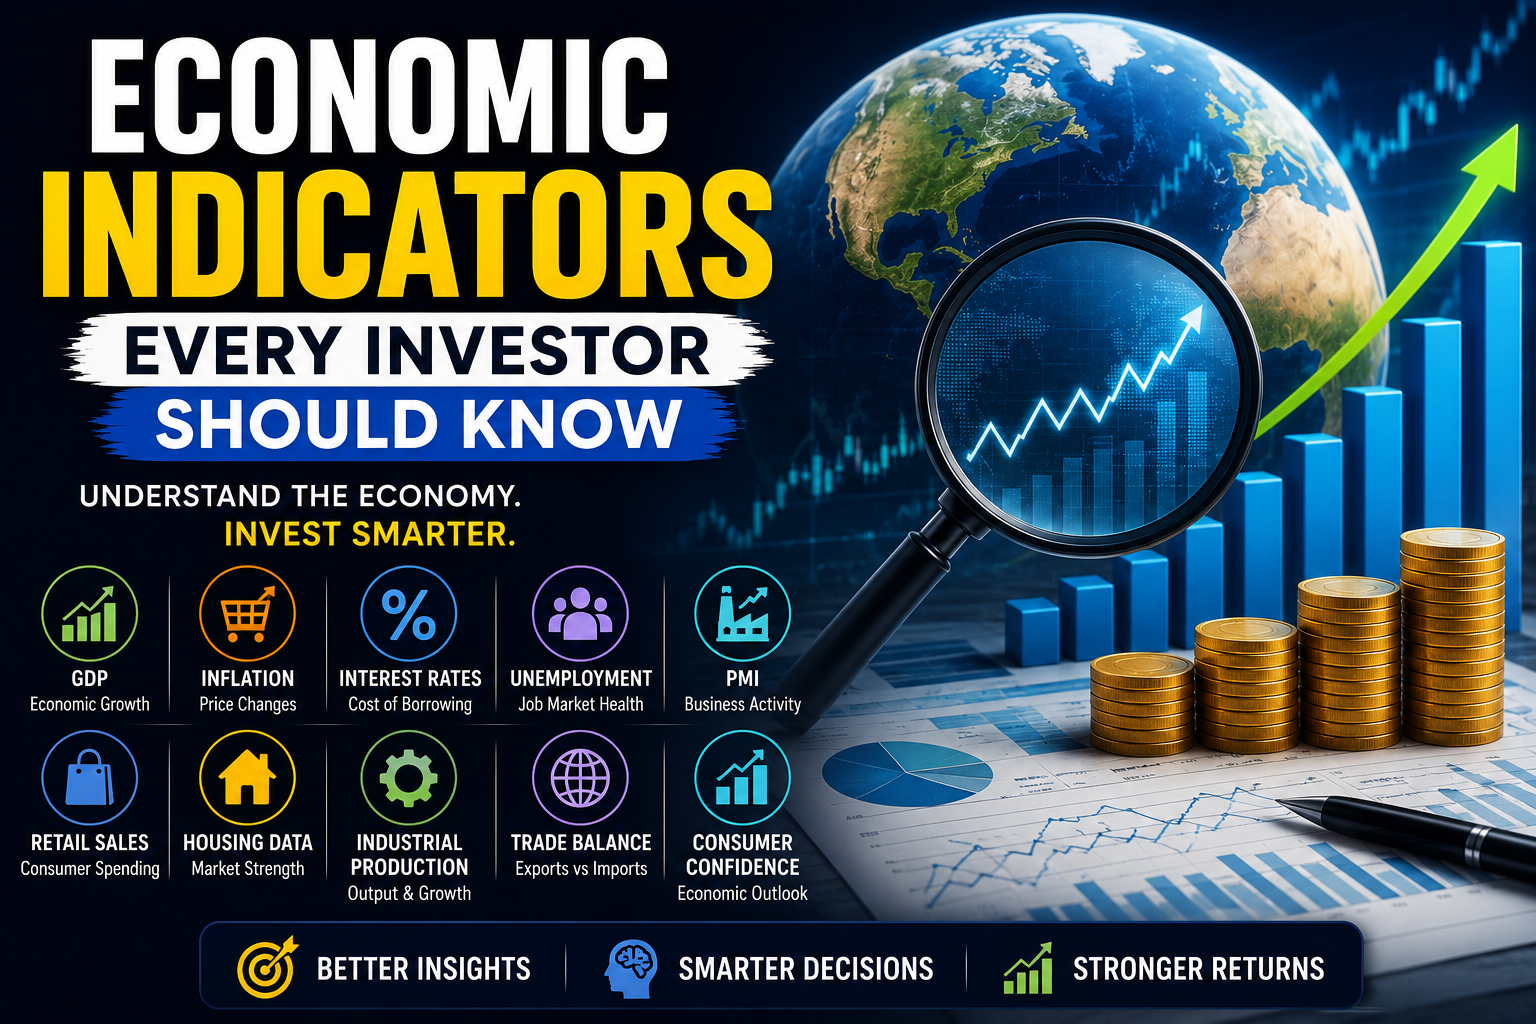
Discover the most important economic indicators every investor should know. Learn how GDP, inflation, interest rates, unemployment, PMI, and other key indicators influence stock markets, bonds, and investment decisions.
Whether you’re investing in stocks, ETFs, mutual funds, bonds, or even cryptocurrencies, understanding economic indicators can give you a significant advantage. While company earnings and financial statements are important, broader economic data often drives market sentiment long before individual businesses report their results.
Imagine two companies with strong profits. If inflation suddenly spikes, central banks raise interest rates, and consumer spending slows, both companies could still see their stock prices decline. That’s because investors don’t only react to company performance—they react to the health of the overall economy.
Economic indicators provide valuable insights into where an economy is heading. Governments, central banks, institutional investors, hedge funds, and multinational corporations monitor these indicators closely to make strategic decisions. As an individual investor, understanding them can help you interpret market movements, identify potential opportunities, and avoid making emotional investment decisions.
In this guide, we’ll explore the most important economic indicators every investor should know, explain how they work, and discuss why they matter for your investment portfolio.
What Are Economic Indicators?
Economic indicators are statistical measures that provide information about the current condition and future direction of an economy. They help economists, policymakers, businesses, and investors evaluate economic performance and identify trends.
These indicators cover a wide range of areas, including economic growth, inflation, employment, manufacturing, consumer confidence, trade, and housing.
Rather than relying on opinions or speculation, investors use economic indicators to make data-driven decisions.
For a deeper understanding of economic data and statistics, visit the Organisation for Economic Co-operation and Development (OECD):
https://www.oecd.org
Why Economic Indicators Matter for Investors
Financial markets don’t simply react to current events—they respond to expectations about the future.
If investors expect economic growth to accelerate, stock markets often rise before official GDP numbers are released. Similarly, if inflation is expected to increase, bond markets and equity markets may react months in advance.
Economic indicators help investors:
- Assess economic strength
- Predict market trends
- Evaluate investment risks
- Understand central bank decisions
- Identify opportunities across different sectors
- Build diversified portfolios based on economic cycles
No single indicator tells the complete story. Instead, experienced investors analyze multiple indicators together before making investment decisions.
1. Gross Domestic Product (GDP)
Gross Domestic Product, or GDP, measures the total value of all goods and services produced within a country’s economy over a specific period. It is one of the most widely followed indicators of economic growth.
A rising GDP generally indicates that businesses are producing more, consumers are spending more, and the economy is expanding. Strong GDP growth often supports higher corporate profits, which can be positive for stock markets.
However, extremely rapid GDP growth can also contribute to inflation, prompting central banks to raise interest rates.
Investors monitor quarterly GDP reports to understand whether an economy is expanding or contracting.
Learn more from the World Bank’s GDP resources:
https://www.worldbank.org
2. Inflation
Inflation measures how quickly the prices of goods and services increase over time.
Moderate inflation is considered healthy because it often reflects growing economic activity. However, high inflation reduces purchasing power, increases business costs, and can negatively affect investment returns.
Central banks around the world closely monitor inflation before deciding whether to raise or lower interest rates.
For investors, inflation influences nearly every asset class.
High inflation can:
- Pressure stock valuations
- Reduce bond prices
- Increase commodity prices
- Support investments in inflation-resistant assets
Common inflation measures include:
- Consumer Price Index (CPI)
- Producer Price Index (PPI)
The International Monetary Fund (IMF) regularly publishes global inflation outlooks:
https://www.imf.org
3. Interest Rates
Interest rates represent the cost of borrowing money.
Central banks such as the U.S. Federal Reserve, the European Central Bank, and the Bank of England adjust interest rates to control inflation and stabilize economic growth.
Higher interest rates usually make borrowing more expensive for businesses and consumers. This can reduce spending, slow economic activity, and affect corporate earnings.
Lower interest rates often encourage borrowing, investment, and consumer spending, which may support stock market growth.
Growth-oriented technology companies are particularly sensitive to changes in interest rates because their valuations depend heavily on future earnings.
Understanding interest rate decisions is essential for every investor.
The Federal Reserve explains monetary policy in detail:
https://www.federalreserve.gov
4. Unemployment Rate
The unemployment rate measures the percentage of people actively seeking work but unable to find employment.
Low unemployment generally indicates a strong economy with healthy consumer spending.
However, extremely low unemployment may contribute to wage inflation, increasing costs for businesses.
High unemployment can signal economic weakness and reduced consumer demand.
Investors often compare employment data with other indicators such as inflation and GDP before drawing conclusions.
5. Consumer Confidence Index (CCI)
Consumer spending accounts for a significant portion of economic activity in many countries.
The Consumer Confidence Index measures how optimistic consumers feel about their financial situation and the economy.
When confidence is high, people tend to spend more on housing, travel, vehicles, electronics, and entertainment.
When confidence declines, consumers often reduce discretionary spending, affecting company revenues.
Retail, hospitality, and luxury goods companies are especially influenced by consumer confidence.
6. Purchasing Managers’ Index (PMI)
The Purchasing Managers’ Index measures business activity in manufacturing and services.
PMI is considered one of the earliest indicators of economic momentum.
Generally:
- Above 50 indicates economic expansion
- Below 50 indicates contraction
Because PMI is released monthly, investors use it as an early signal before GDP reports become available.
Manufacturing, industrial, and logistics companies often react strongly to PMI data.
7. Retail Sales
Retail sales measure consumer spending across stores, online retailers, and other businesses.
Strong retail sales suggest healthy consumer demand and economic growth.
Weak retail sales may indicate slowing economic activity or declining consumer confidence.
Companies in retail, consumer goods, payment services, and e-commerce closely monitor these reports.
8. Housing Market Data
Housing is one of the largest sectors of most economies.
Investors watch:
- Home sales
- Building permits
- Housing starts
- Mortgage applications
Strong housing activity often reflects consumer confidence and economic expansion.
Construction companies, banks, real estate firms, and building material manufacturers are particularly affected by housing trends.
9. Industrial Production
Industrial production measures output from factories, mining operations, and utilities.
Growing industrial production often indicates stronger business investment and increased demand.
This indicator is especially important for investors in manufacturing, commodities, transportation, and energy sectors.
10. Trade Balance
The trade balance compares a country’s exports with its imports.
A trade surplus occurs when exports exceed imports.
A trade deficit occurs when imports exceed exports.
Trade data can influence:
- Currency values
- Manufacturing activity
- Commodity demand
- International investment flows
Global investors closely monitor trade relationships between major economies because they affect multinational companies.
Leading, Lagging, and Coincident Indicators
Economic indicators are generally divided into three categories.
Leading Indicators
These predict future economic activity.
Examples include:
- PMI
- Stock market performance
- Building permits
- Consumer expectations
Coincident Indicators
These reflect the economy’s current condition.
Examples include:
- GDP
- Industrial production
- Personal income
Lagging Indicators
These confirm trends after they have already developed.
Examples include:
- Unemployment
- Corporate profits
- Interest expenses
Successful investors often combine all three categories rather than relying on one indicator alone.
How Investors Use Economic Indicators Together
Professional investors rarely make decisions based on a single economic report.
For example:
Imagine GDP is growing, unemployment is falling, and consumer confidence is improving.
These indicators together suggest a strengthening economy, which may support corporate earnings and stock prices.
Now imagine inflation rises sharply while central banks increase interest rates.
Growth may slow, borrowing costs increase, and investors may shift toward defensive sectors such as healthcare, utilities, and consumer staples.
Understanding the relationship between multiple indicators provides a more complete view of market conditions.
Common Mistakes Investors Make
Many beginners misunderstand economic indicators.
Some common mistakes include:
- Focusing on one indicator while ignoring others
- Reacting emotionally to headlines
- Assuming positive economic data always leads to rising stock prices
- Ignoring how central banks interpret economic reports
- Making short-term investment decisions based on a single monthly release
Markets often react not to the data itself but to whether the results exceed or fall short of expectations.
Frequently Asked Questions
What is the most important economic indicator for investors?
There is no single most important indicator. GDP, inflation, interest rates, employment, and consumer spending all provide valuable insights when analyzed together.
How often are economic indicators released?
Some indicators, such as inflation and employment data, are released monthly, while GDP is usually published quarterly.
Do economic indicators affect stock prices?
Yes. Economic indicators influence investor expectations, corporate earnings forecasts, interest rates, and overall market sentiment.
Can economic indicators predict recessions?
While no indicator guarantees a recession forecast, weakening GDP growth, declining PMI, rising unemployment, and falling consumer confidence often signal increasing economic risks.
Conclusion
Understanding Economic Indicators is one of the most valuable skills an investor can develop. These data points provide a clearer picture of economic health and help explain why financial markets move the way they do.
Rather than reacting to headlines or short-term market volatility, investors who follow indicators such as GDP, inflation, interest rates, unemployment, PMI, retail sales, and consumer confidence are better equipped to make informed, long-term investment decisions.
No economic indicator should be viewed in isolation. The most successful investors evaluate multiple data points together, consider global economic trends, and adjust their strategies based on evidence rather than emotion.
Whether you’re investing for retirement, building long-term wealth, or managing a diversified portfolio, understanding economic indicators can help you navigate changing market conditions with greater confidence and discipline.
Learn the difference between Small Cap vs Mid Cap vs Large Cap stocks, including their risks, returns, benefits, and which investment category best suits your financial goals.
